emissionen

Der Kohlenstoff-Fußabdruck des Lebensmittelsystems wurde weit unterschätzt

Der Kohlenstoff-Fußabdruck des Lebensmittelsystems wurde weit unterschätzt

Ihr Studie ergab, dass das globale Lebensmittelsystem im Jahr 2018 für 16 Milliarden Tonnen Treibhausgasemissionen verantwortlich war, was einem Drittel aller globalen Emissionen in diesem Jahr entspricht. Dies steht in scharfem Kontrast zum enger definierten Landwirtschaftssektor der IPCC-Kategorien für Treibhausgasinventare, auf den 2018 5,3 Milliarden Tonnen entfielen, also nur ein Zehntel der Gesamtemissionen. […] „Die nationalen Treibhausgasinventare, [gemäß] den IPCC-Richtlinien, brechen die Komponenten der Lebensmittel-Emissionen auf, trennen sie und verbergen sie in [anderen] Kategorien.“ […] Zu den nach IPCC nicht-landwirtschaftlich zugerechneten Kategorien gehören Kohlendioxid-Emissionen aus der Vorproduktion, z. B. bei der Herstellung von Düngemitteln und landwirtschaftlichen Geräten, und Emissionen aus der Nachproduktion, z. B. bei der Entsorgung von Lebensmittelabfällen, Kühlung, Verpackung und Transport. Zu den lebensmittelbedingten Emissionen zählt auch die Umwandlung natürlicher Ökosysteme in landwirtschaftliche Flächen, die mit fast 3 Milliarden Tonnen pro Jahr die größte Einzelquelle für Treibhausgasemissionen in der Analyse darstellt.

Quelle: CivilEats

Posted by Stefan in Artikel, Klimaveränderung, Konsum, Landwirtschaft, Wirtschaft, 0 comments

47 Luxusliner pusten mehr Dreck in die Luft als 260 Millionen Autos

Das Hauptziel dieser Studie ist die Analyse der Luftverschmutzung durch luxuriöse Passagier-Kreuzfahrtschiffe in europäischen Gewässern. Die Ergebnisse zeigen, dass die Luxus-Kreuzfahrtmarken der Carnival Corporation & PLC im Jahr 2017 allein in europäischen Meeren zehnmal mehr Schwefeldioxid verursachen als alle über 260 Millionen europäischen Pkw. Spanien, Italien, Griechenland, Frankreich und Norwegen sind die am stärksten von der Luftverschmutzung durch Kreuzfahrtschiffe in Europa betroffenen Länder. Unter den großen Kreuzfahrthäfen sind Barcelona, Palma Mallorca und Venedig die am stärksten belasteten.

Posted by Stefan in Artikel, Klimaveränderung, Konsum, 0 comments

Artikel: Alarmierende Studie zeigt dass die US Düngerindustrie 100 mal mehr Methan emittiert als von ihr geschätzt

Holla die Waldfee: Das ist mehr als nur ein bisschen daneben liegen und ist eine äusserst beunruhigende Nachricht für den Klimawandel: »Eine beunruhigende neue Studie von Forschern der Cornell University und des Environment Defense Fund hat unabhängig voneinander die Methanemissionen aus einer Reihe von Ammoniakdüngemittelanlagen gemessen. Die erstaunlichen Ergebnisse deuten darauf hin, dass die Methanemissionen 100-mal höher sind als die Branchenschätzungen und dreimal höher als die Schätzung der Environmental Protection Agency für alle industriellen Methanemissionen in den Vereinigten Staaten. […] Die Studie skalierte diese [gemessene] Zahl [Menge] dann auf alle Düngemittelhersteller in den Vereinigten Staaten und berechnete die jährlichen Methanemissionen auf 28 Gigagram. Berichten zufolge schätzt die Industrie ihre Methanemissionen nur auf 0,2 Gigagram pro Jahr. Die EPA behauptet derzeit, dass alle industriellen Prozesse und Produktverwendungen in den Vereinigten Staaten insgesamt 8 Gigagram Methanemissionen verursachen.«

Posted by Stefan in Artikel, Landwirtschaft, Technik, Wirtschaft, 0 comments

Uno-Bericht: Erdtemperatur könnte um drei Grad steigen

Nicht überraschend und noch sicher konservativ gerechnet: „Die Ziele des Klimaabkommens von Paris werden bei Weitem nicht erreicht, wenn alle Länder so weitermachen wie bisher. Selbst bei Einhaltung aller bisher vorgelegten Klimaschutzzusagen wird sich die Erdtemperatur laut Uno-Umweltprogramm (Unep) bis Ende des Jahrhunderts um mindestens drei Grad im Vergleich zur Zeit vor der Industrialisierung erhöhen.“ Sagt der neue UNEP-Bericht.
„Viele Wissenschaftler warnen schon bei plus 1,5 Grad bis Ende des Jahrhunderts vor für die Menschheit kaum tragbaren Folgen: Schmelzen der Eiskappen, Anstieg der Meeresspiegel, mehr Wetterextreme. … 80 bis 90 Prozent der weltweiten Kohlereserven müssen im Boden bleiben, wenn die Klimaziele erreicht werden sollen.“
Spiegel.de

Posted by Stefan in Klimaveränderung, Konsum, Wirtschaft, 0 comments

Lesenswerte Artikel

Screen Shot 2016-03-18 at 08.41.07

Screen Shot 2016-03-18 at 08.40.26

Treibhausgase: Forscher ermitteln Chinas Beitrag zur Klimaerwärmung. Fast ein Viertel des Treibhausgases CO2 stammt mittlerweile aus China – dennoch ist das Land derzeit nur für ein Zehntel der Erwärmung verantwortlich, sagt eine Studie. Sie liefert noch weitere Überraschungen.

Erfolg im Klimaschutz: Energiebedingter CO2-Ausstoß steigt nicht weiter. Fortschritte bei der Eindämmung des CO2-Ausstoßes: Zwei Jahre nacheinander sind die globalen Emissionen durch die Energieerzeugung nicht gestiegen. In Deutschland schwärzen Stromexporte die CO2-Bilanz.

Treibhausgas: CO2 macht großen Sprung. Das Treibhausgas CO2 gilt als Treiber der Klimaerwärmung. Nun melden Forscher die schnellste Zunahme des Gases seit Beginn der Messungen.

Posted by Stefan in Artikel, Klimaveränderung, Konsum, Natur, Peak Oil, Wirtschaft, 0 comments

Da haben wir es: Die globale Erwärmung erreicht die Ein-Grad-Schwelle

Picture 1

Die Weltgemeinschaft möchte die globale Erwärmung auf zwei Grad begrenzen. Neue Daten zeigen: Die Hälfte ist erreicht. 2015 dürfte die Ein-Grad-Marke knacken. Das ist zwar teils „nur“ möglich gewesen dank El Nino. Jedoch: Es gab ja nun schon früher viele El Ninos, und die 1°-Marke wurde nie überschritten. Tja, wir sind auf dem besten Wege zu Klimaveränderungen, die dramatische Auswirkungen haben werden. Das 2°C-Ziel ist, meiner Meinung nach, so gut wir komplett unrealistisch. Wer fängt denn nun wirklich an, weniger CO2 in die Luft zu blasen? Gerade erst wurde ja vorgerechnet, dass China sogar noch höhere Emissionen hat als die Zahlen die angegeben wurden. Und von einer Reduzierung sind wir in fast allen Ländern der Erde weit entfernt.

Hier der Artikel im Spiegel, hier in der englischen Quelle.

Posted by Stefan in Artikel, Klimaveränderung, 0 comments

Fleischkonsum und CO2-Emissionen. Was hat das eine mit dem anderen zu tun?

Screen Shot 2015-02-02 at 17.49.41

Die Landwirtschaft hat ja bekanntermassen einen grossen Anteil an den vom Menschen verursachten Treibhausgasemissionen. Einen ziemlich grossen Anteil daran hat die Tierhaltung – wobei hier unterschieden werden muss zwischen „natürlicher“ und industrieller Tierhaltung. Zum einen weil Regenwälder abgeholzt werden um dann großflächig (meist Gen-manipuliertes) Soja (mit hohem Herbizideinsatz – Monsanto lässt grüssen) anzubauen; zum anderen weil dann dieses Soja nach Europa geschifft wird um dort in den Massentierhaltungen die Tiere damit zu füttern, die wiederum solche Mengen von Gülle produzieren, dass diese nicht mehr „natürlich“ verarbeitet und ausgebracht werden kann. Wie Joel Salatin sagt: Da wo es stinkt, stimmt was nicht. Zu diesem Thema habe ich vor ein paar Jahren mal einen Artikel geschrieben, den ich hier mal mit euch teilen will. An sich hat sich an der Situation nichts verändert, im Gegenteil. Ausser der Erkenntnis, dass der Ansatz des Holistic Managements von Allan Savory mich davon überzeugt hat dass „richtiges“, der Natur abgeschautes und an die Natur angepasstes Weidemanagement ein riesiges Potential zur Bodenverbesserung, „Renaturierung“ und CO2-Speicherung bietet.

Posted by Stefan in Artikel, Konsum, Landwirtschaft, Natur, 0 comments

Growing Greenhouse Gas Emissions Due to Meat Production (Englisch)

Figure 1

Both intensive (industrial) and non-intensive (traditional) forms of meat production result in the release of significant amounts of greenhouse gases (GHGs). As meat supply and consumption increase around the world, more sustainable food systems must be encouraged.

Why is this issue important?

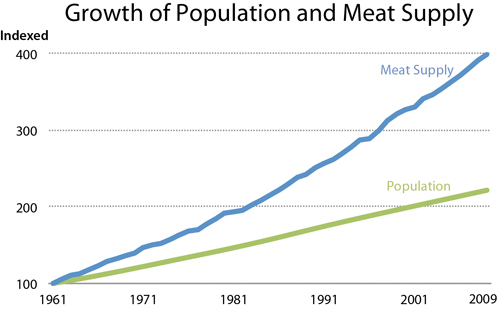
For many thousands of years, mankind has lived in close proximity with numerous animal species, providing them with food and shelter in exchange for their domestic use and for products such as meat and milk, feathers, wool and leather. As the economy in some (mostly western) countries slowly grew, industrial style agriculture replaced traditional small-scale farming. Pasturage and use of animal manure as fertilizer was abandoned. The increasing efficiency of industrial agriculture has led to reduced prices for many of our daily products. It helped to reliably nourish large populations, and turned a food that was an occasional meal—meat—into an affordable, every-day product for many (Figure 1).

Figure 1: Growth of population and meat supply, indexed 1961=100 (FAO 2012a, UN 2012)

Full Size Image

However, the true costs of industrial agriculture, and specifically „cheap meat“, have become more and more evident. Today, „the livestock sector emerges as one of the top two or three most significant contributors to the most serious environmental problems“ (Steinfeld et al. 2006). This includes stresses such as deforestation, desertification, „excretion of polluting nutrients, overuse of freshwater, inefficient use of energy, diverting food for use as feed and emission of GHGs“ (Janzen 2011). Perhaps the most worrisome impact of industrial meat production, analyzed and discussed in many scientific publications in recent years, is the role of livestock in climate change. The raising of livestock results in the emission of methane (CH4) from enteric fermentation1 and nitrous oxide (N2O) from excreted nitrogen, as well as from chemical nitrogenous (N) fertilizers used to produce the feed for the many animals often packed into „landless“ Concentrated Animal Feeding Operations (CAFOs) (Lesschen et al. 2011, Herrero et al 2011, O’Mara 2011, Janzen 2011, Reay et al. 2012).

What are the findings?

Meat Supply

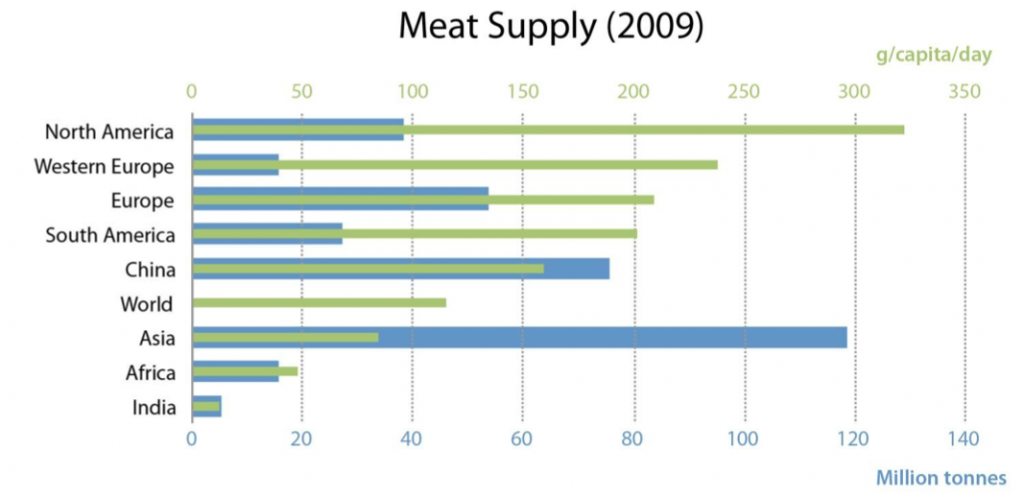
Meat supply varies enormously from region to region, and large differences are visible within regions (Figures 2-4). The USA leads by far with over 322 grams of meat2 per person per day (120 kg per year), with Australia and New Zealand close behind. Europeans consume slightly more than 200 grams of meat (76 kg per year); almost as much as do South Americans (especially in Argentina, Brazil and Venezuela). Although Asia’s meat consumption is only 25 per cent of the U.S. average (84 grams per day, 31 kg per year), there are large differences, for example, between the two most populous countries: China consumes 160 grams per day, India only 12 grams per day. The average meat consumption globally is 115 grams per day (42 kg per year).

Figure 2

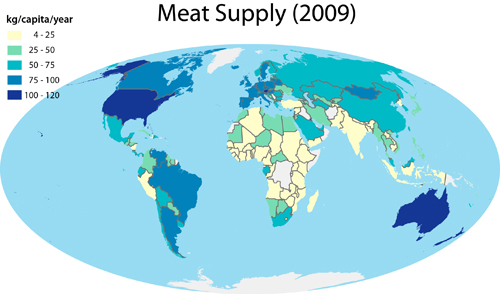
Figure 2: Meat supply around the world (kg/capita/year) (FAO 2012a)

Full Size Image

Figure 3

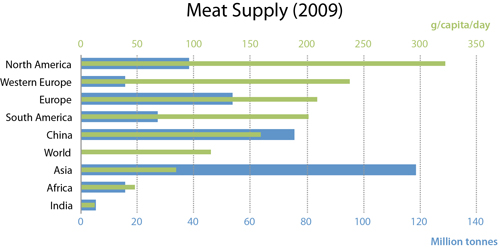
Figure 3: Meat supply (g/capita/day and tonnes) for selected countries/regions (FAO 2012a)

Full Size Image

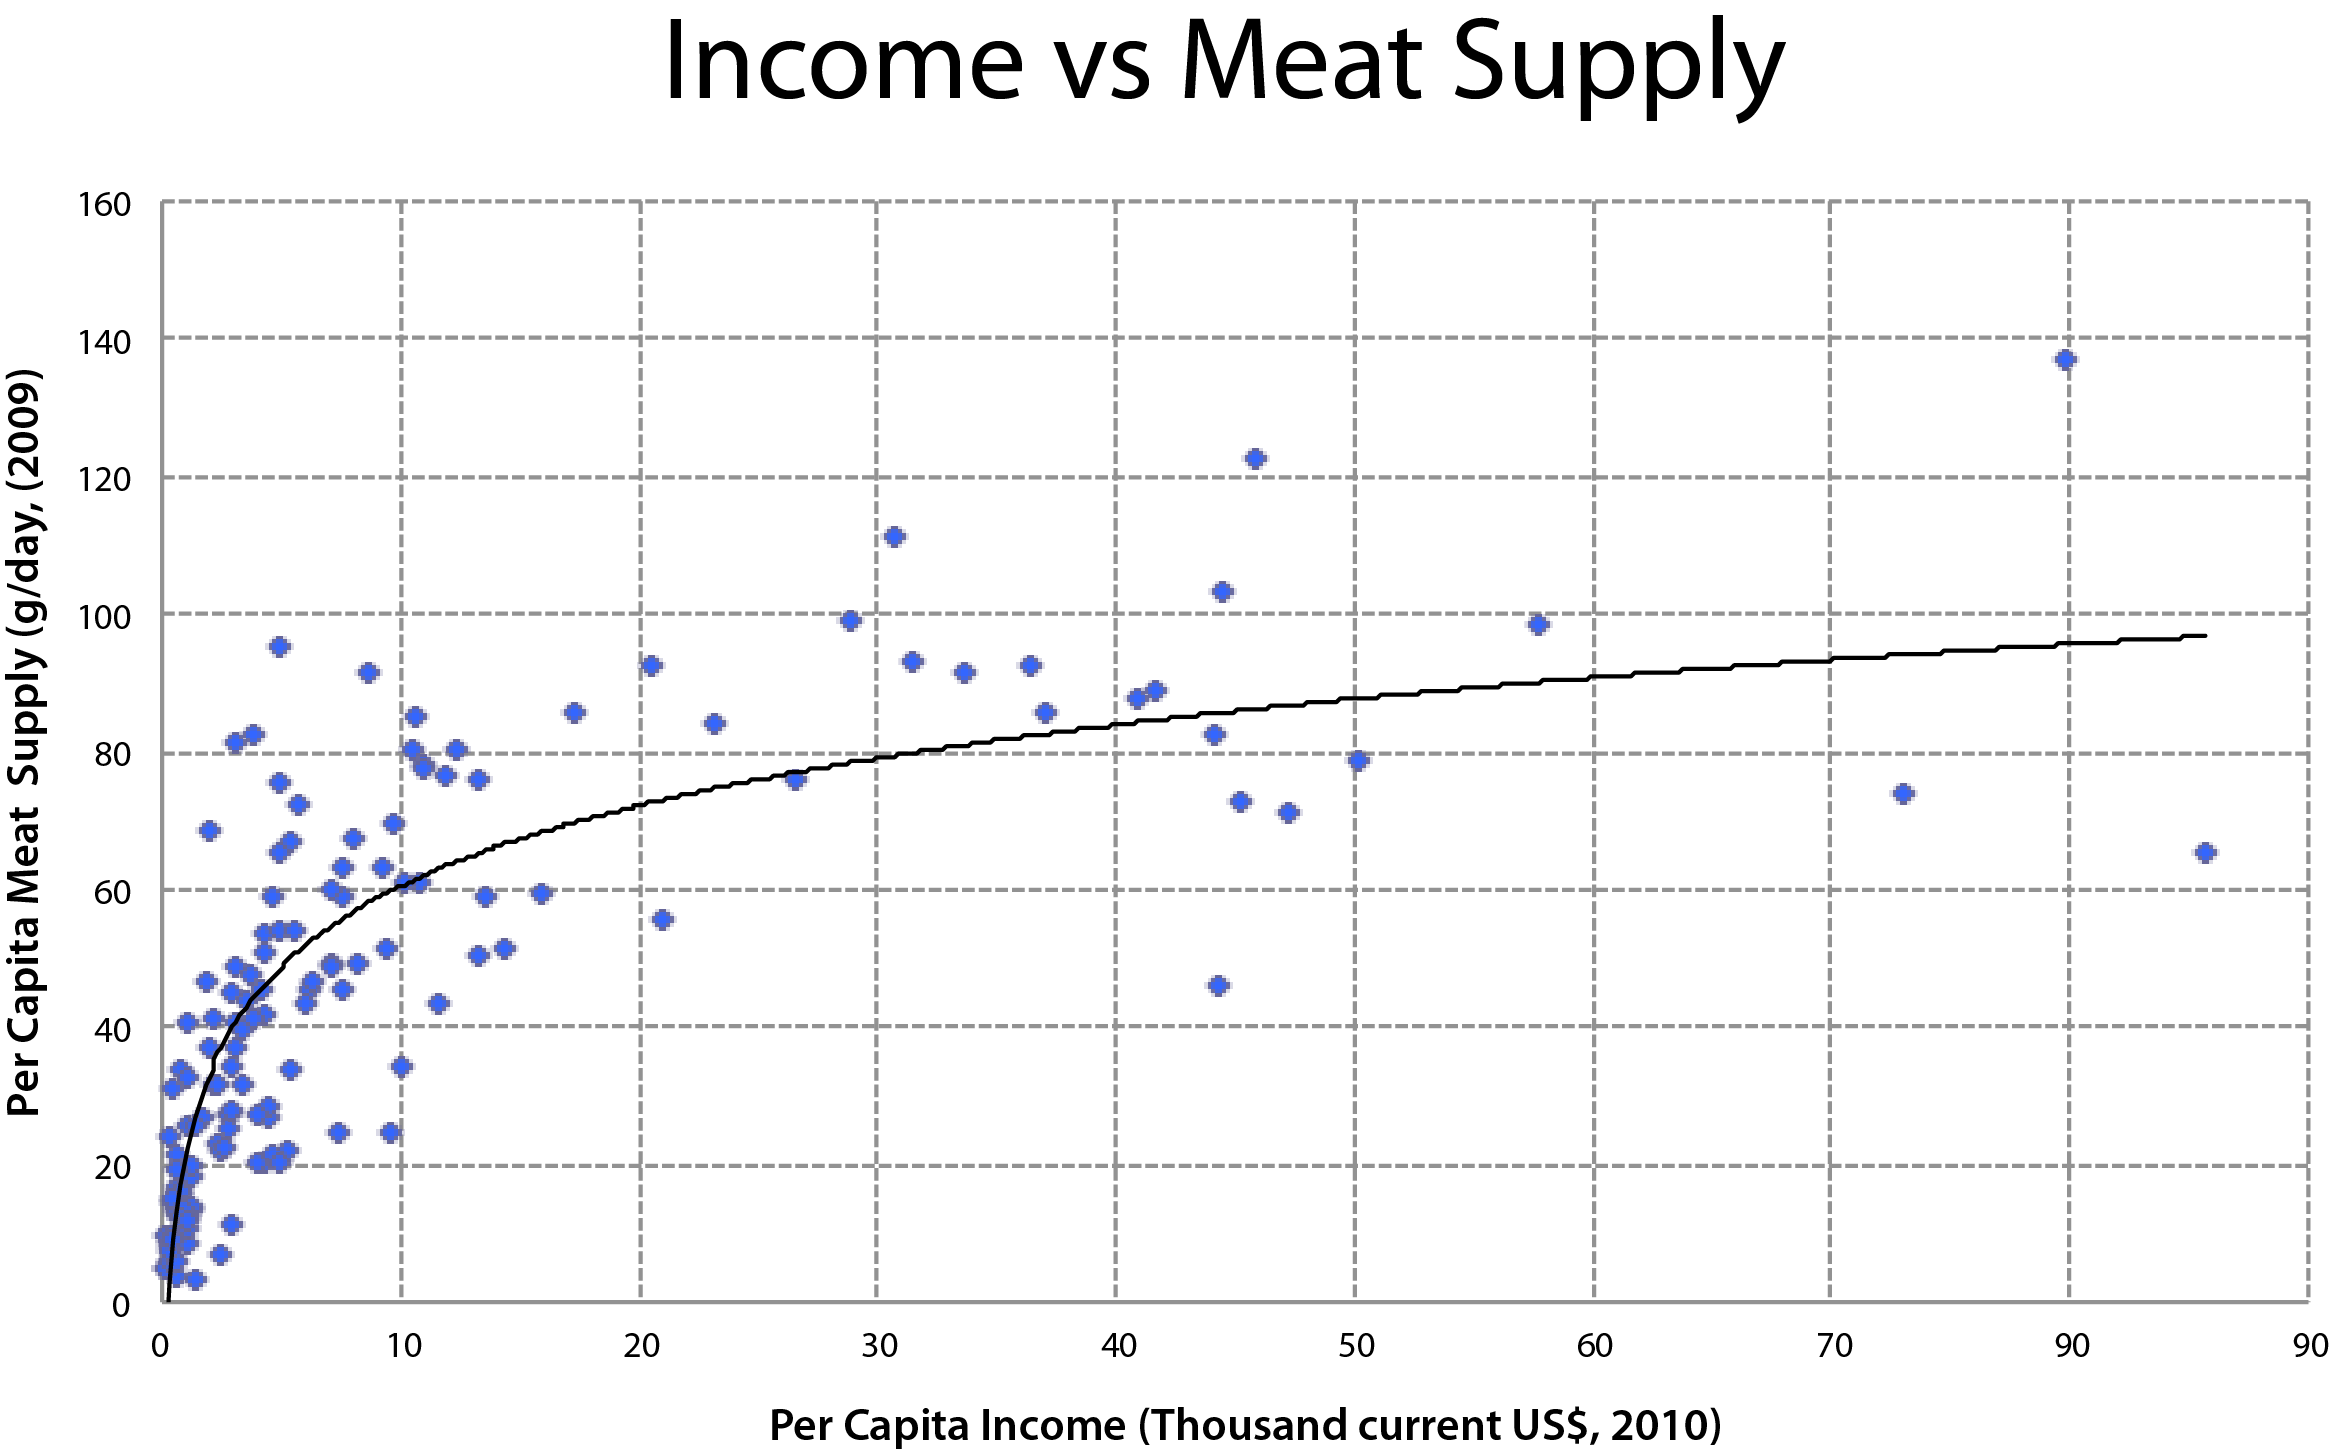
Over the past few decades, meat supply has grown in most of the world’s regions (Figure 4), with Europe being the main exception. The growth in per capita consumption is strongly linked to increasing levels of income in many countries of the world (Figure 5). Higher incomes translate into demand for more valued, higher protein nutrition (Delgado et al. 1999). The effect of increased income on diets is greatest among lower- and middle-income populations (WRI 2005). One of the fastest growing meat consuming regions is Asia, particularly China. Total meat consumption has increased 30-fold since 1961 in Asia, and by 165 per cent since 1990 in China. Per capita meat consumption has grown by a factor of 15 since 1961 in Asia and by 130 per cent since 1990 in China (FAO 2012a).

Figure 4

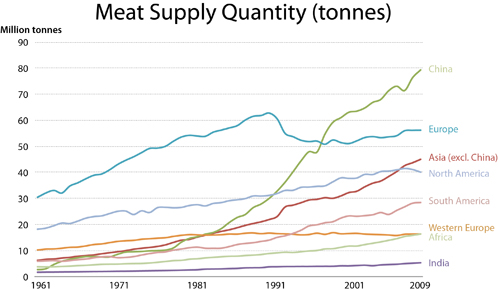
Figure 4: Trends in meat supply for selected countries/regions between 1961 and 2009 (FAO 2012a)

Full Size Image

Figure 5

Figure 5: Per capita income versus meat consumption (FAO 2012a, World Bank 2012)

Full Size Image

Not only has per capita consumption grown, but there are also millions more consumers of meat. The global human population grew from around 5 billion in 1987 to 7 billion in 2011, and is expected to reach 9 billion people in 2050. Thus, the total amount of meat produced climbed from 70 million tonnes in 1961 to 160 million tonnes in 1987 to 278 million tonnes in 2009 (FAO 2012a), an increase of 300 per cent in 50 years (Figure 1). The FAO (Steinfeld et al. 2006) expects that global meat consumption will rise to 460 million tonnes in 2050, a further increase of 65 per cent within the next 40 years.

Photo 2: Kurman Communications, Inc/Flickr.com

The role of (animal) agriculture in climate change

Agriculture, through meat production, is one of the main contributors to the emission of greenhouse gases (GHGs) and thus has a potential impact on climate change. Estimates of the total emissions from agriculture differ according to the system boundaries used for calculations. Most studies attribute 10-35 per cent of all global GHG emissions to agriculture (Denman et al. 2007, EPA 2006, McMichael 2007, Stern 2006). Large differences are mainly based on the exclusion or inclusion of emissions due to deforestation and land use change.

Recent estimates concerning animal agriculture’s share of total global GHG emissions range mainly between 10-25 per cent (Steinfeld et al. 2006, Fiala 2008, UNEP 2009, Gill et al. 2010, Barclay 2012), where again the higher figure includes the effects of deforestation and other land use changes and the lower one does not. According to Steinfeld et al. (2006) and McMichael et al. (2007), emissions from livestock constitute nearly 80 per cent of all agricultural emissions.

Types of emissions

In contrast to general trends of GHG emissions, carbon dioxide (CO2) is only a small component of emissions in animal agriculture. The largest share of GHG emissions is from two other gases: methane (CH4) and nitrous oxide (N2O). These are not only emitted in large quantities, but are also potent greenhouse gases, with a global warming potential (GWP3) of 25 using a 100-year timeframe for methane and a GWP of 296 for N2O.

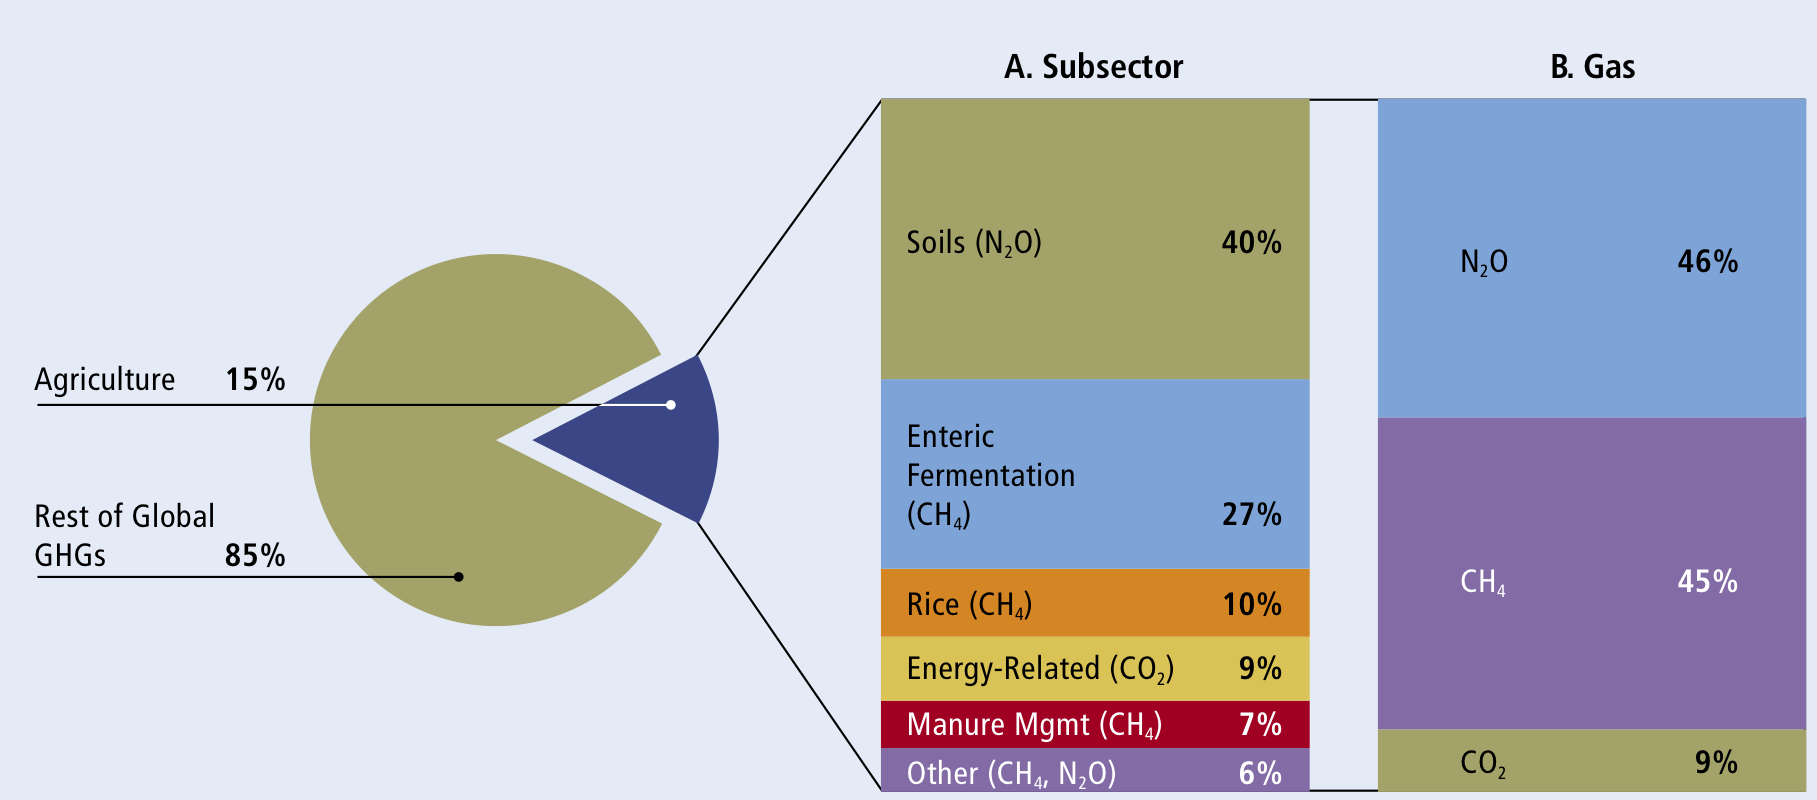
Globally, about 9 per cent of emissions in the entire agricultural sector consist of CO2, 35-45 per cent of methane and 45-55 per cent of nitrous
oxide (WRI 2005, McMichael et al. 2007, IPCC 2007) (Figure 6).

Figure 6

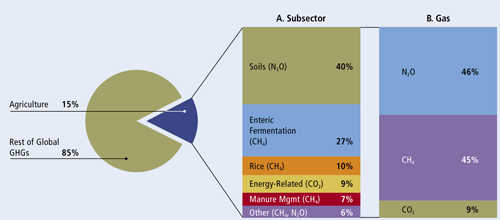
Figure 6: GHG emissions from agriculture (WRI 2005)

Full Size Image

The main sources of CH4 are the enteric fermentation of ruminants and releases from stored manure, which also emits N2O. The application of manure as well as N fertilizers to agricultural land increases emissions of N2O. Furthermore, N2O as well as CO2 are released during production of chemical N fertilizers. Some CO2 is also produced on farms from fossil fuels and energy usage and, as some authors highlight, by the exhalation of animals, which is generally not taken into account (Goodland and Anhang 2009, Herrero et al. 2011). Additionally, deforestation and conversion of grassland into agricultural land release considerable quantities of CO2 and N2O into the atmosphere, as the soil decomposes carbon-rich humus (FAO 2010). In Europe (the EU-27), for example, enteric fermentation was the main source (36 per cent) of GHG emissions in the livestock sector, followed by N2O soil emissions (28 per cent) (Lesschen et al. 2011). Livestock are also responsible for almost two-thirds (64 per cent) of anthropogenic ammonia emissions, which contribute significantly to acid rain and acidification of ecosystems (Steinfeld et al. 2006).

Amount and geographic distribution of bovine animals and emissions

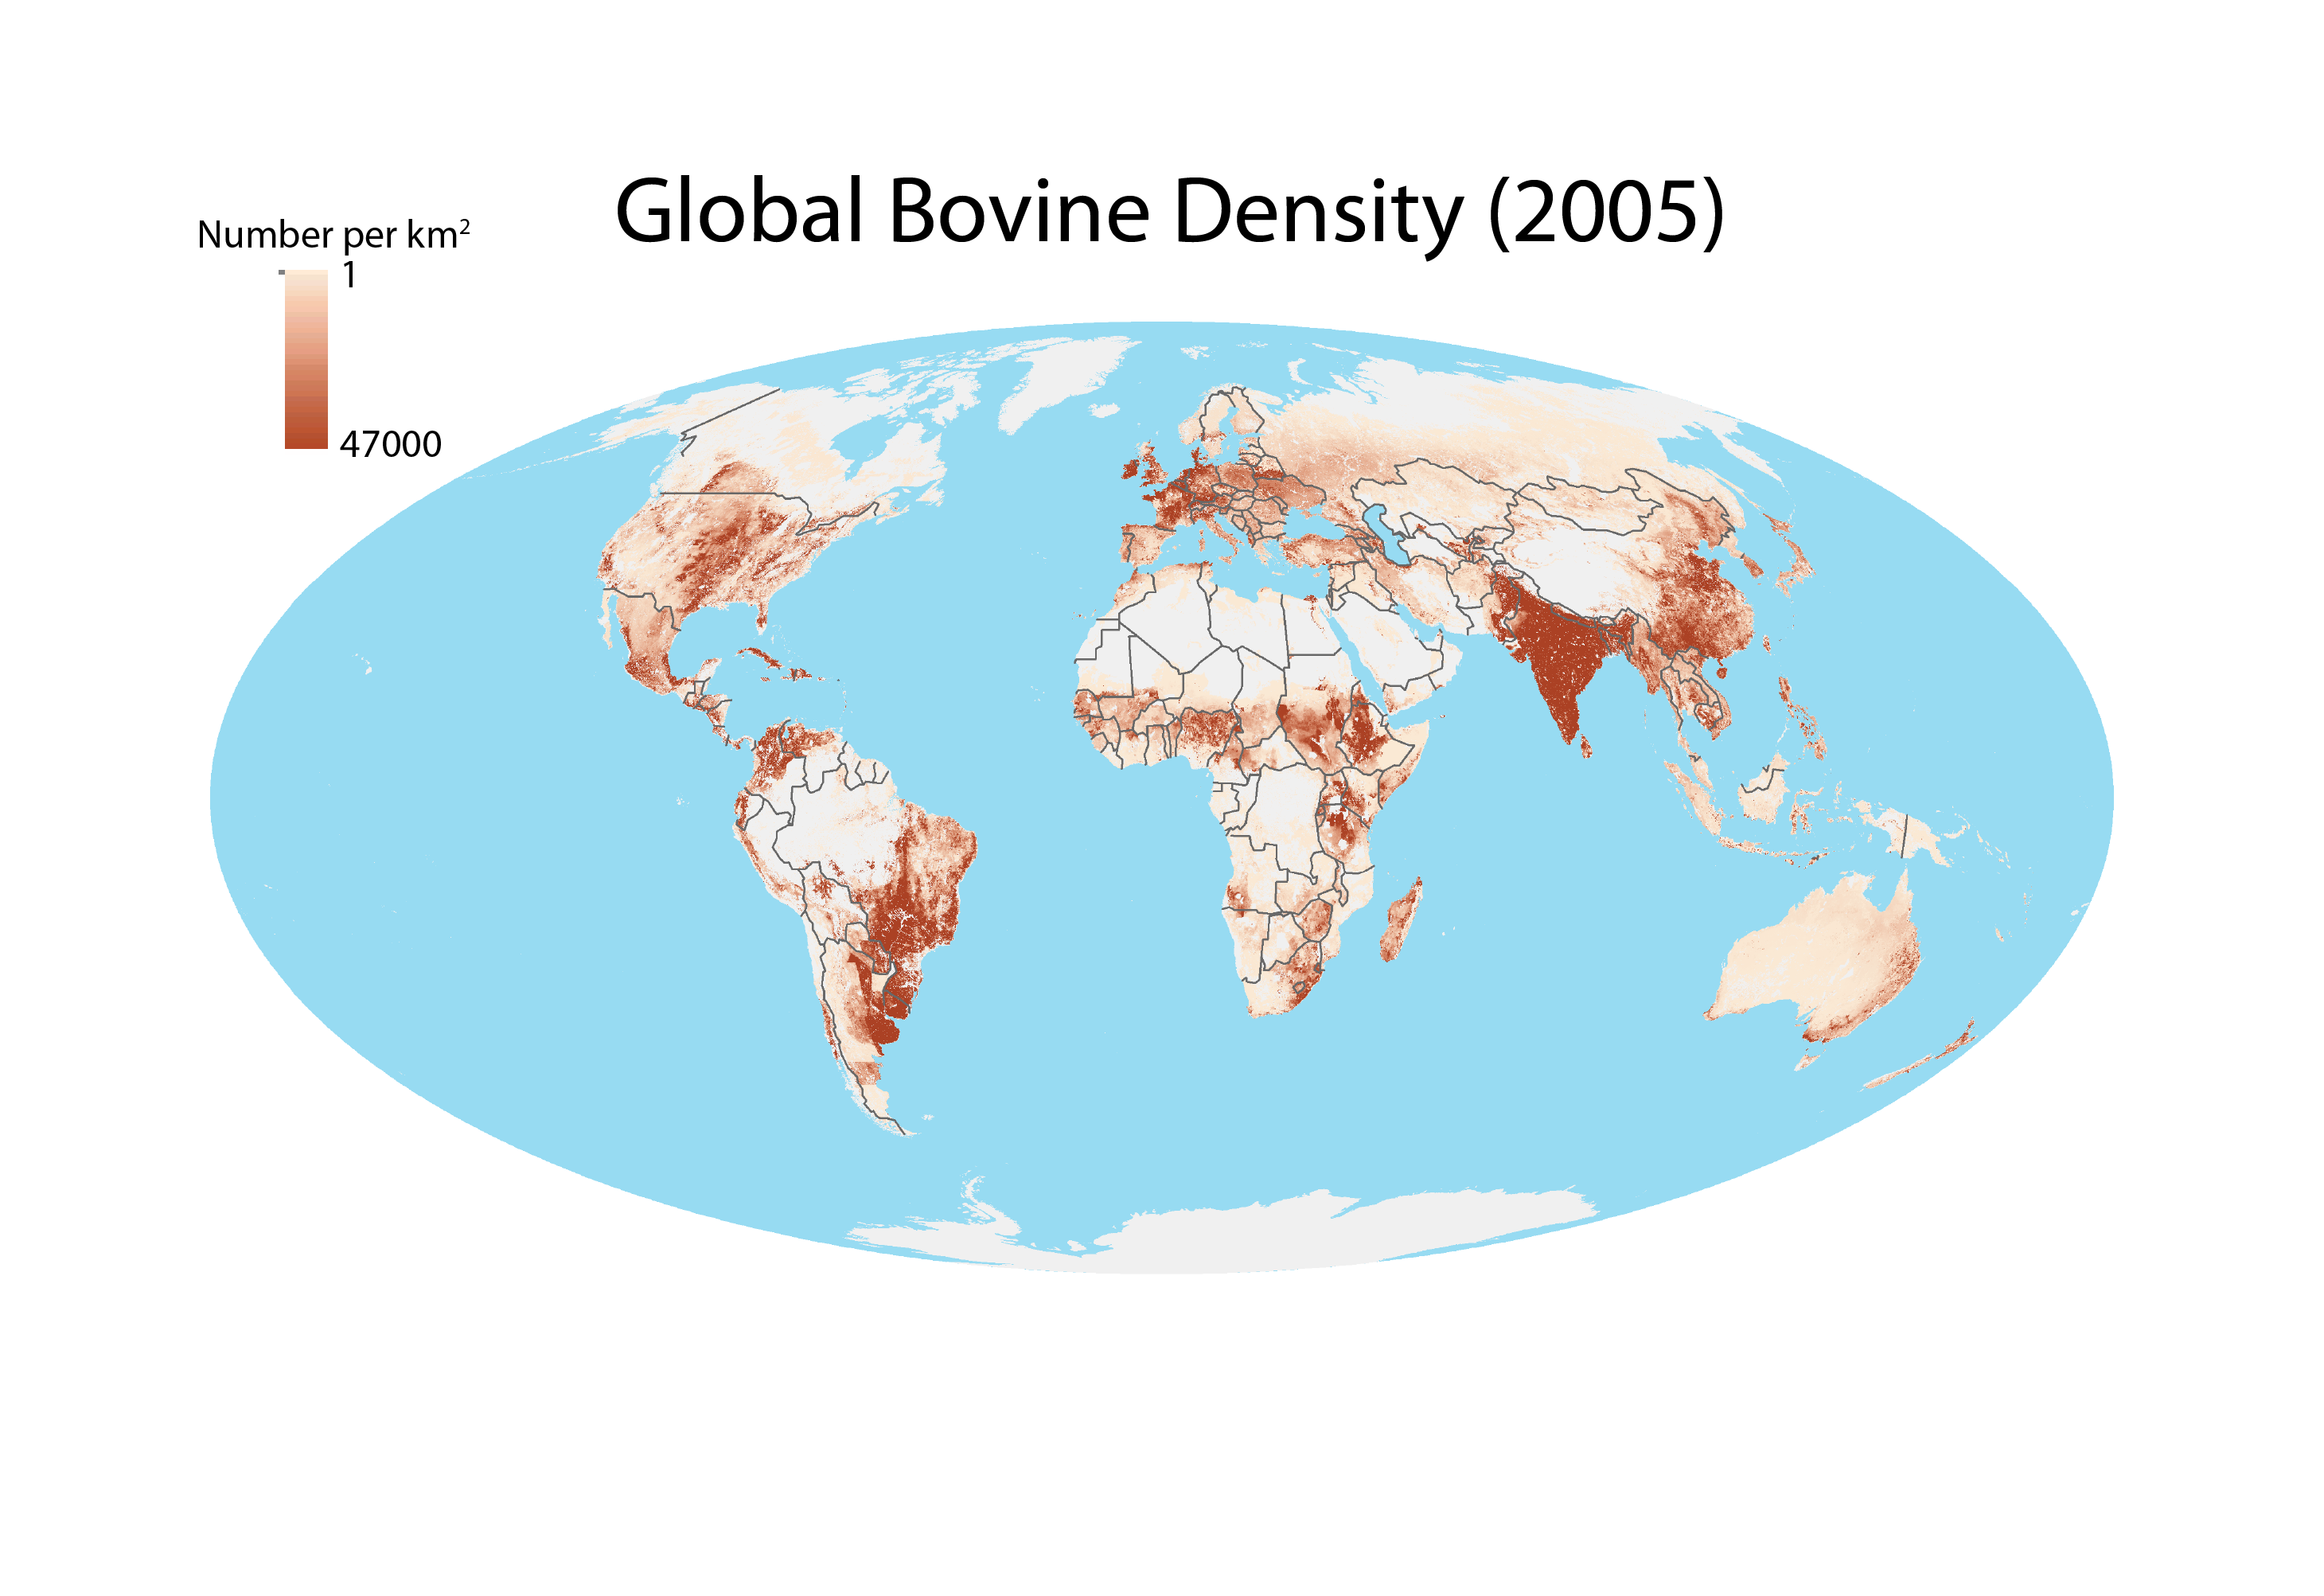
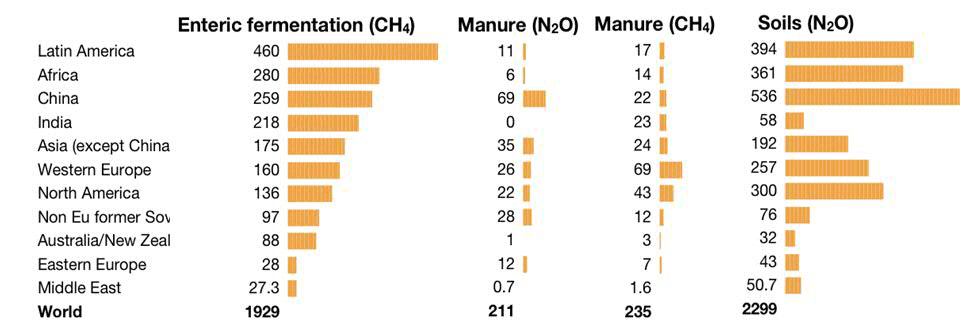
Cattle are by far the largest contributors to global enteric CH4 emissions, as they are the most numerous and have a much larger body size relative to other species such as sheep and goats. Out of the 1.43 billion cattle (FAO 2012a) (Figure 7) in 2010, 33 per cent were in Asia, 25 per cent in South America and 20 per cent in Africa. Asia is the main source of CH4 emissions, with almost 34 per cent of global emissions (Figure 8). China is a major source of enteric emissions and, while Indians are low meat consumers, India as a country also has high levels of CH4 emissions. Latin America follows with 24 per cent and Africa with 14.5 per cent. China, Western Europe and North America are the regions with the highest emissions from manure.

Figure 7

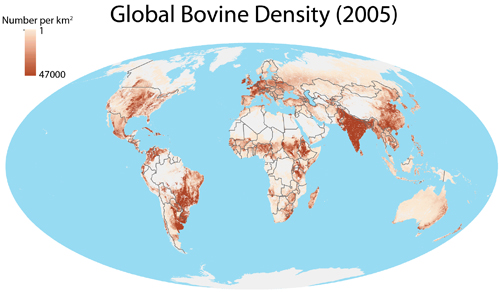
Figure 7: Bovine density distribution worldwide (FAO 2012b)

Full Size Image

Photo 3: net_efekt/Flickr.com

Figure 8

Figure 8: Regional emissions of major agricultural greenhouse gases (million tonnes of CO2-eq/year)
(EPA (2006) and O’Mara (2011), re-expressed by the author)

Full Size Image

Emissions for a meal

In an analysis of the EU-27 countries, „beef had by far the highest GHG emissions with 22.6 kg CO2-eq/kg“4(Lesschen et al. 2011) in comparison to other products such as pork (2.5), poultry (1.6) and milk (1.3). A study in the UK found that emissions from beef amount to 16 kg CO2-eq/kg beef compared to 0.8 kg CO2-eq/kg of wheat (Garnett 2009). In an analysis of commonly consumed foods in Sweden, the total GHG emissions for beef summed up to 30 kg CO2-eq/kg beef (Carlsson-Kanyama and González 2009).The authors conclude that „it is more “climate efficient“ to produce protein from vegetable sources than from animal sources“, and add that „beef is the least efficient way to produce protein, less efficient than vegetables that are not recognized for their high protein content, such as green beans or carrots“. In terms of GHG emissions „the consumption of 1 kg domestic beef in a household represents automobile use of a distance of ~160 km (99 miles)“ (Carlsson-Kanyama and González 2009). By one estimate, about 35 kilojoules (kJ) of fossil energy are required to produce 1 kJ of beef raised in a CAFO/feedlot (Hillel and Rosenzweig 2008).

Animal Feed and Manure

Under natural conditions which were maintained for thousands of years and still widely exist around the world, there is a closed, circular system, in which some animals feed themselves from landscape types which would otherwise be of little use to humans (Garnett 2009, UNEP 2012). They thus convert energy stored in plants into food, while at the same time fertilizing the ground with their excrements. Although not an intensive form of production, this co-existence and use of marginal resources was, and still is in some regions, an efficient symbiosis between plant life, animal life and human needs. (Godfray et al. 2010, Janzen 2011)

In many parts of the world „traditional“ forms of animal agriculture have to a certain extent been replaced by a „landless“, high-density, industrial-styled animal production system, exemplified by the phenomenon known as Concentrated Animal Feeding Operations (CAFO). Those „factories“ hold hundreds or thousands of animals, and often buy and import animal feed from farmers far away. The feeding of livestock, and their resulting manure, contributes to a variety of environmental problems, including GHG emissions (Janzen 2011, Lesschen et al. 2011). High-energy feed is based on soya and maize in particular, cultivated in vast monocultures and with heavy use of fertilizers and herbicides. It is then imported (at least in Europe and most parts of Asia) from countries as far away as Argentina and Brazil (Steinfeld et al. 2006). This has serious consequences in terms of land-use change in those feed-for-export production countries. Furthermore, this manure is generated in huge quantities. In the USA alone, operations which confine livestock and poultry animals generate about 500 million tonnes of manure annually, which is three times the amount of human sanitary waste produced annually (EPA 2009). Insufficient amounts of land on which to dispose of the manure results in the runoff and leaching of waste into and the contamination of surface and groundwater.

What are the implications and potential solutions?

Livestock in many regions of the world, and especially in dry areas, act as a „savings bank“ (Oenema and Tamminga 2005): a principal way of making use of a harsh environment, a „setting aside“ of food (and more generally, the value of this resource) for dry times, a main source of high-protein food. It contributes important non-food goods and services. Livestock rearing and consumption in these regions is a way of life, critical to pastoralists‘ identity, and should be protected and supported.

At present, the ecological foundations of agriculture are being undermined (UNEP 2012). At the same time, industrial agriculture is itself contributing to environmental problems such as climate change. However, there are mitigation techniques to reduce the impact of both intensive and non-intensive animal production on climate (McMichael et al. 2007, Gill et al. 2010, O’Mara 2011, Lesschen et al. 2011). Most of these are related to soil carbon sequestration5, „which was estimated to contribute 89 per cent of the technical mitigation potential“ (O’Mara 2011). Many of them have costs of implementation substantially reducing their potential. A reduction of non-carbon dioxide emissions of up to 20 per cent should, however, be possible at realistic costs (McMichael et al. 2007). Other mitigation solutions include improved feedstock efficiency and diets; the reduction of food waste and improved manure management (Steinfeld et al. 2006, McMichael et al. 2007). Farm scale and landscape scale strategies for making agriculture more sustainable are further outlined in Avoiding Future Famines (UNEP 2012).

Changes in human diet may also be a practical tool to reduce GHG emissions. As a large percentage of beef is consumed in hamburgers or sausages, „the inclusion of protein extenders from plant origin would be a practical way to replace red meats“ (Carlsson-Kanyama and González 2009). A switch to less „climate-harmful“ meat may also be possible, as pigs and poultry produce significantly less methane than cows. They are however more dependent on grain and soy-products and may thus still have a negative impact on GHG emissions (Barclay 2011). Grass-fed meat and resulting dairy products may be more environmentally friendly than factory-farmed or grain-fed options. Labeling of products, indicating the type of animal feed used, could allow consumers to make more informed choices (FOE 2010).

Scientists agree that in order to keep GHG emissions to 2000 levels the projected 9 billion inhabitants of the world (in 2050) need to each consume no more than 70-90 grams (McMichael et al. 2007, Barclay 2011) of meat per day. To meet this target, substantial reductions in meat consumption in developed countries and constrained growth in demand in developing ones would be required. A reduction in the consumption of meat, especially red meat, could have multiple health benefits, as there is clear evidence of a link between high meat diets and bowel cancer and heart disease (FOE 2010). A study modeling consumption patterns in the United Kingdom estimates that a 50 per cent reduction in meat and dairy consumption, if replaced by fruit, vegetable and cereals, could result in a 19 per cent reduction in GHG emissions and up to nearly 43,600 fewer deaths per year in the UK (Scarborough et al. 2012). However, the health effects of nutrient deficiencies that may result from reduced meat and dairy consumption still would need to be examined.

In short, the human health implications of a reduced meat diet need further exploration, but it seems probable that many benefits would accrue from lower consumption rates in many developed and some developing countries. At the same time, reduced meat production would ease both pressures on the remaining natural environment (i.e. less new land clearance for livestock) and on atmospheric emissions of CO2, CH4 and N2O. As changing the eating habits of the world’s population will be difficult and slow to achieve, a long campaign must be envisioned, along with incentives to meat producers and consumers to change their production and dietary patterns. „Healthy“ eating is not just important for the individual but for the planet as a whole.

1 In the normal livestock digestive process microbes in the animal’s digestive system ferment food, converting plant material into nutrients that the animal can use. This fermentation process, known as enteric fermentation, produces methane as a by-product.

2 Roughly, the equivalent of three hamburgers.

3 GWP compares other gases‘ warming potency to that of CO2, which has its GWP set at 1.

4 The term „CO2 equivalent“ is a metric measure used to compare the emissions from various greenhouse gases on the basis of their global-warming potential (GWP), by converting amounts of other gases to the equivalent amount of carbon dioxide with the same global warming potential“ (Eurostat n.d.).

5 Soil carbon sequestration is the process of capturing atmospheric CO2 and storing it over long time in the soil.

Acknowledgement

Written by: Stefan Schwarzera, b with inputs from and editing by Ron Witta and Zinta Zommersc.

Production and Outreach Team: Arshia Chanderd, Erick Litswac, Kim Giesed, Michelle Anthonyd, Reza Hussaind, Theuri Mwangid.

(a UNEP/DEWA/GRID-Geneva, b University of Geneva, c UNEP/DEWA/Nairobi, d UNEP GRID Sioux Falls )

References

Barclay, J. M.G. (2012). Meat, a damaging extravagence: a response to Grumett and Gorringe. The Expository Times. 123(2) 70-73. doi: 10.1177/0014524611418580.

Carlsson-Kanyama, A., González, A. D. (2009). Potential contributions of food consumption patterns to climate change. The American Journal of Clinical Nutrition 2009; 89 (suppl): 1704S-9S. doi: 10.3945

Delgado, C., Rosegrant, M., Steinfeld, H., Ehui, S., Courbois, C. (1999). Livestock to 2020: The next food revolution. Food, Agriculture, and the Environment Discussion Paper 28. Washington, DC, IFPRI/FAO/ ILRI (International Food Policy Research Institute/ FAO/International Livestock Research Institute).

Denman, K.L., Brasseur, G., Chidthaisong, A., Ciais, P., Cox, P.M., Dickinson, R.E., Hauglustaine, D., Heinze, C., Holland, E., Jacob, D., Lohmann, U., Ramachandran, S., da Silva Dias, P.L., Wofsy, S.C., Zhang, X. (2007). Couplings between changes in the climate system and biogeochemistry. In: Solomon, S., Qin, D., Manning, M., Chen, Z., Marquis, M., Averyt, K.B., Tignor, M., Miller, H.L. (Eds.), Climate Change 2007: The Physical Science Basis. Contribution of Working Group I to the Fourth Assessment Report of the Intergovernmental Panel on Climate Change. Cambridge University Press, Cambridge, UK and New York, NY, USA, pp. 499–587.

Eurostat. (n.d.). Glossary:Carbon dioxide equivalent. Accessed online on Oct 22, 2012 at http://epp.eurostat.ec.europa.eu/statistics_explained/index.php/Glossary:CO2_equivalent

EPA (2006). Global Anthropogenic Non-CO2 Greenhouse Gas Emissions: 1990-2020. United States Environmental Protection Agency, EPA 430-R-06-003, June 2006. Washington, DC, USA. www.epa.gov/nonCO2/econ-inv/dow.

EPA (2009). Compliance and Enforcement National Priority: Concentrated Animal Feeding Operations (CAFOs). Accessed online on Oct 22, 2012 at http://www.epa.gov/oecaerth/resources/publications/data/planning/priorities/fy2008prioritycwacafo.pdf

FAO (2010). Greenhouse gas emissions from the dairy sector. A life cycle assessment. Food and Agriculture Organization of the United Nations, Rome, Italy.

FAO (2012a). Food and Agriculture Organization of the United Nations. Data accessed on Aug 30, 2012 at http://faostat.fao.org/

FAO (2012b). Food and Agriculture Organization of the United Nations. Data accesses on Aug 30, 2012 at http://www.fao.org/geonetwork/srv/en/metadata.show?id=12713.

Fiala, N. (2008). Meeting the Demand: An Estimation of Potential Future Greenhouse Gas Emissions from Meat Production. Ecological Economics 67, 412-419.

FOE (2010). Healthy Planet Eating: How lower meat diets can save lives and the planet. Friends of the Earth.

Garnett, T. (2009). Livestock-related greenhouse gas emissions: impacts and options for policy makers. Environmental Science and Policy 12, 491–504.

Gill, M., Smith, P., Wilkinson, J.M. (2010). Mitigating climate change: the role of domestic livestock. Animal 4, 323–333.

Godfray, H.C.J., Beddington, J.R., Crute, I.R., Haddad, L., Lawrence, D., Muir, J.F., Pretty, J., Robinson, S., Thomas, S.M., Toulmin, C. (2010). Food security: the challenge of feeding 9 billion people. Science 327, 812–818.

Goodland, R., Anhang, J. (2009). Livestock and Climate Change. What if the key actors in climate change were pigs, chickens and cows? Worldwatch November/December 2009, Worldwatch Institute, Washington, DC, USA, pp. 10–19.

Herrero, M., Gerber, P., Vellinga, T. , Garnett, T. , Leip, A., Opio, C., Westhoek, H.J., Thornton, P.K., Olesen, J., Hutchings, N., Montgomery, H., Soussana, J.-F., Steinfeld, H., McAllister, T.A. (2011). Livestock and greenhouse gas emissions: The importance of getting the numbers right, Animal Feed Science and Technology, Volumes 166–167, 23 June 2011, Pages 779-782, ISSN 0377-8401, 10.1016/j.anifeedsci.2011.04.083.

Hillel, D., Rosenzweig, C. (2008). Biodiversity and food production. In: Chivian, E., Bernstein, A. (Eds.), Sustaining Life – How Human Health Depends on Biodiversity. Oxford University Press, Oxford, UK, pp. 325–381.

IPCC (2007). Intergovernmental Panel on Climate Change. Working group III. Climate change 2007: mitigation of climate change. Accessed online on Oct 22, 2012 at
http://www.ipcc.ch/publications_and_data/publications_ipcc_fourth_assessment_report_wg3_report_mitigation_of_climate_change.htm

Janzen, H.H. (2011). What place for livestock on a re-greening earth? Animal Feed Science and Technology, 166-167, 783-796.

Lesschen, J.P., van der Berg, M., Westhoek, H.J., Witzke, H.P. and Oenema, O. (2011). Greenhouse gas emission profiles of European livestock sectors. Animal Feed Science and Technology, 166-167, 16-28

McMichael, A.J., Powles, J.W., Butler, C.D. and Uauy, R. (2007). Food, livestock production, energy, climate change, and health. Lancet 370, 1253–1263.

O’Mara, F.P. (2011). The significance of livestock as a contributor to global greenhouse gas emissions today and in the near future. Animal Feed Science and Technology, 166-167, 7-15.

Oenema, O. and Tamminga, S. (2005). Nitrogen in global animal production and management options for improving nitrogen use efficiency. Science in China Series C: Life Sciences 48, 871–887.

Reay, D.S., Davidson, E.A., Smith, K.A., Smith, P., Melillo, J.M., Dentener, F., Crutzen, P.J. (2012). Global agriculture and nitrous oxide emissions. Nature Climate Change. Vol 2

Scarborough P, Allender S, Clarke D, Wickramasinghe K,and Rayner M. (2012) Modelling the health impact of environmentally sustainable dietary scenarios in the UK. European Journal of Clinical Nutrition, doi:10.1038/ejcn.2012.34.

Steinfeld, H., Gerber, P., Wassenaar, T., Castel, V., Rosales, M. and de Haan, C. (2006). Livestock’s long shadow: Environmental issues and options. Food and Agriculture Organization of the United Nations (FAO), Rome, Italy.

Stern, N. (2006). The economics of climate change: the Stern review. Cambridge: Cambridge University Press, 2006.

UN (2012). UN Data. United Nations. Data accessed on Aug 30, 2012 at http://data.un.org/

UNEP (2009). The environmental food crisis – The environment’s role in averting future food crises. United Nations Environment Programme, Arendal

UNEP (2012). Avoiding future famines: Strengthening the ecological foundation of food security through sustainable food systems. United Nations Environment Programme, Nairobi, Kenya

World Bank (2012). Data accessed on Aug 30, 2012 at http://data.worldbank.org/

WRI. (2005). Navigating the numbers: Greenhouse Gas Data and International Climate Policy. World Resources Institute. Accessed online on Oct 22, 2012 at http://pdf.wri.org/navigating_numbers.pdf

Download the PDF.

by Stefan Schwarzer

Posted by Stefan in Artikel, Landwirtschaft, Tiere, 0 comments

Keeping Track of Our Changing Environment—From Rio to Rio +20 (1992-2012)

Hier ein Artikel von mir, der vor der Rio+20 Konferenz erschien und auf diesem Bericht, ebenfalls (zum grössten Teil) von mir verfasst, beruht. Eine PDF Version kann hier runter geladen werden.

Thumbnail

In 1992, the first United Nations Conference on Sustainable Development, popularly known as the Rio Earth Summit, was convened in Rio de Janeiro, Brazil to address the state of the environment and sustainable development. The Earth Summit yielded several important agreements including „Agenda 21“, a plan of action adopted by over 178 governments to address human impacts on the environment at local, national and global levels, and key treaties on climate change, desertification and biodiversity. At the second Conference in 2002—the World Summit on Sustainable Development—governments agreed on the Johannesburg Plan of Implementation, reaffirming their commitment to Agenda 21. In 2012, the United Nations Conference on Sustainable Development, or Rio+20 Earth Summit, will focus on the Green Economy in the context of sustainable development, poverty eradication, and the institutional framework for sustainable development. The object is to renew political commitment to sustainable development, review progress and identify implementation gaps, and address new and emerging challenges.

Why is this issue important?

This article, and a related publication called „Keeping Track of Our Changing Environment“ (UNEP 2011), serve as a timely update on what has occurred since the Earth Summit of 1992 and are part of the wider Global Environment Outlook-5 (GEO-5) preparations leading up to the release of the landmark GEO-5 report in June 2012. It underlines how in just twenty years, the world has changed more than most of us could ever have imagined—geopolitically, economically, socially and environmentally. Very few individuals outside academic and research communities envisaged the rapid pace of change or foresaw developments such as the phenomenal growth in information and communication technologies, ever-accelerating globalisation, private sector investments across the world and the rapid economic rise of a number of „developing“ countries. Many rapid changes have also taken place in our environment, from the accumulating evidence of climate change and its very visible impacts on our planet, to biodiversity loss and species extinctions, further degradation of land surfaces and the deteriorating quality of oceans. Certainly, there have been some improvements in the environmental realm, such as the significant reduction in ozone-depleting chemicals and the emergence of renewable energy sources, for which new investments totaled more than $200 thousand million in 2010. But in too many areas, the environmental „dials“ continue to head into the red.

Overall demographic and economic situation

In the past two decades, the number of people living on the planet increased by 26%, exceeding (end of October 2011) 7 000 million. A positive, although in the short-term not directly remarkable aspect is that the population growth rate is slowly declining, dropping from 1.65% in 1992 to 1.2% in 2010, which represents a 27% decline in the growth rate over that period. One general trend in the population distribution is clearly visible: the urban population is increasing steadily, growing from 2 400 million people (43% of total population) to 3 400 million (50%) in 2009, an increase of 45%. This trend in urbanization is expressed by the 110% increase of „megacities“x (cities with at least 10 million people), from 10 in 1992 to 21 in 2010. These growth rates have brought new and emerging social, economic and environmental challenges. Although the share of the urban population living in slums in the developing world has dropped from 46% to 33% as a result of improved housing and sanitation, the absolute number of slum-dwellers has increased by 171 million people, raising their number to 827 million in 2010.


Figure 1

Figure 1: More energy and natural resources are being consumed, but the amounts needed per product are declining

Full Size Image

While total GDP grew by 75% and per capita GDP by 40%, there are evidently large regional and national differences (seven-fold between „developed“ and „developing“ regions), although growth rates were much higher in the last 10 years in developing countries than in the developed ones. At the same time, international trade has increased between 1992 and 2008 from US$ 9 to 36 million millions (an increase of 280%), before falling a bit in the aftermath of the economic crisis. As societies grow and become wealthier, demand for basic materials (minerals, fossil fuels, biomass) grew by over 40% between 1992 and 2005, from about 42 to nearly 60 thousand million tonnes. Nonetheless, there is a simultaneous decline in emissions, energy and material use per unit of output, indicating that resource efficiency is slowly increasing. At the same time, source and effect of the economic growth is a growing electricity production, increasing by 66% between 1992 and 2008, with developing countries showing more than three times larger growth rates (68%) than developed countries.

The (mostly) bad news

With fossil fuels taking up over 80% of the total primary energy supply and their use rising by almost 40% between 1992 and 2009, emissions of CO2 increased by 38%, reaching 36 000 million tonnes in 2010. Although developing countries, through their general economic growth and many large-scale development projects, had the highest growth rates (64%), the difference of per capita emissions between developing and developed countries is still nearly a factor of 10. The steadily increasing amount of fossil fuels burned for generating energy and heating (26% of global anthropogenic GHG emissions, 2004), industry (19%), agriculture (14%), transport (13%) and other uses, leads to an increasing concentration of atmospheric CO2, which rose from 357 parts per million in 1992 to 389 early 2011, an increase of 9% (IPCC 2007). At the same time, global temperatures show a slow, but steady increase of about 0.2°C per decade (Hansen and others 2006).

Figure 2

Figure 2: Global CO2 emissions continue to rise, with 80% emitted by only 19 countries (* from fossil fuels, gas flaring, cement production, asprovided through the original source)

Full Size Image

Figure 3

Figure 3: The average amount of CO2 in the Earth’s atmosphere shows a steady rise over the last two decades

Full Size Image

Figure 4

Figure 4: Far northern latitudes are seeing the most extreme changes in temperature

Full Size Image

Figure 5

Figure 5: The annual minimum extent of Arctic sea ice continues its steady

Full Size Image

According to rankings from four top US, British and Japanese climate research centers, the ten hottest years on record have all occurred since 1998; and 18 out of the last 21 years feature among the 20 warmest years on record since (reliable) recording of temperature started in 1880 (NOAA 2011, NASA 2011, UK-MetOffice 2011, JMA 2011). As a consequence, nearly all mountain glaciers around the world are retreating and getting thinner (WGMS 2010). But increase in global temperature is not occurring uniformly across the globe’s latitudinal zones: far northern latitudes are seeing the most extreme changes in temperature, with increases of up to 3°C, while most of the other latitudes show variations around 0.5°. This impacts the Arctic sea ice extent, which has been steadily declining: its September extent decreased from almost eight to around five million square kilometers between 1992 and 2010, a drop of 35%. Similar to the global atmospheric temperature, the average ocean temperatures are slowly increasing too, rising from 0.22°C above the long-term average in 1992 to nearly 0.5°C in 2010. Due to this rising sea-water temperature and resulting thermal expansion, as well as the melting of ice of the Arctic, Antarctic and Greenland ice sheets, the sea level has been rising globally at an average rate of about 2.5 mm per year between 1992 and 2011 (Bindoff and others 2007). Increasing carbon dioxide concentrations in the air alter the chemistry of the ocean’s surface, causing it to become more acidic (measured by the logarithmic pH) (Caldeira and Wickelt 2003). The ocean’s pH declined from 8.11 in 1992 to 8.06 in 2007 (Feely and others 2009), having potentially significant consequences for marine organisms (UNEP 2010).

Although the rate of deforestation is slowing down, natural forests declined, especially in South America and Africa, by around 13 million hectares per year between 2000 and 2010, compared to 16 million hectares per year during the preceding decade (FAO 2010). This not only results in biodiversity loss, but also contributes 12-15% to global warming (van der Werf and others 2009, UCSUSA 2011). Forest plantations, especially in Asia and to a lesser extent in Europe, have seen an increase of 54% since 1990, covering 265 million hectares in 2010. Although certification for socially and environmentally responsible forestry shows an impressive annual 20% growth rate, only about 10% of forests worldwide were managed under the two biggest labels (FSC, PEFC).

Figure 6

Figure 6: Only about 10% of global forests are under certified sustainable management

Full Size Image

Figure 7

Figure 7: The Living Planet Index has declined by 12% at the global level and by 30% in the tropics

Full Size Image

Figure 8

Figure 8: Each year 52 vertebrate species move one Red List category closer to extinction

Full Size Image

With disappearing forests, industrial agriculture and sprawling urbanization, the health of the earth’s ecosystems is decreasing. The Living Planet Index, which monitors almost 8 000 populations of over 2 500 vertebrate species, shows the most extreme decline – by 30% – in the tropical biome, and drops between 10-15% for marine and freshwater biomes, as well as in the global average. This decrease is mirrored in the Red List Index, which measures the risk of extinction, and which shows general deterioration for birds, mammals and amphibians; each year 52 vertebrate species move on Red List category closer to extinction. In order to halt the constant loss of species and to protect biologically important zones, the total sum of protected land areas increased by 42%, covering 13% of the continents. Marine protected areas, however, cover only around 7% of coastal waters and just above 1.4% of the oceans (IUCN/UNEP 2011, Toropova and others 2010).

Since 1992, the proportion of fully-exploited fish stocks increased by 13% and overexploited, depleted or recovering stocks increased by 33%, reaching 52% and 33%, respectively, of all fish stocks. Only a small percentage of stocks, around 15%, are under-exploited or moderately exploited; these stocks, however, saw a strong decrease of nearly 50% since 1992. This degradation nonetheless was accompanied by a slight decrease in marine fish catch. But with catches of around 80 million tonnes for marine fish and 10 million tonnes (with a steady growth, 66% between 1992 and 2009) for inland water fish, the pressure on water ecosystems remains high (UNEP 2011b). Tuna, for example, is an economically important, globally-traded fish that is increasingly in demand by consumers. Catches increased dramatically, reaching 4200 thousand tonnes in 2008, an increase of 35%, leaving some tuna species on the edge of extinction (IUCN 2011, Collette and others 2011).

Figure 9

Figure 9: 13% of the world’s land surface, 7% of its coastal waters and 1.4% of its oceans are protected

Full Size Image

Figure 10

Figure 10: The depletion of fish stocks is one of the most pressing environmental issue (* Underexploited or moderately exploited = able to produce more than their current catches; overexploited, depleted or recovering from depletion = yielding less than their maximum potential production owing to excess fishing pressure in the past, with a need for rebuilding plans; fully exploited = current catches are at or close to their maximum sustainable productions, with no room for further expansion)

Full Size Image

Aquaculture could help to lessen pressure on wild fish; but with annual growth rates of almost 8% (260% between 1992 and 2009), equaling now more than half of the total wild fish catch, it is often negatively impacting the environment (via loss of mangroves, poor fish-waste management, influx of antibiotics and other reasons) (FAO 2011). Nearly 90% of global aquaculture is practiced in Asia, the vast proportion of which occurs in China.

Figure 11

Figure 11: Higher agricultural yields depend heavily on the use of fertilizers

Full Size Image

Figure 12

Figure 12: Three crops have expanded dramatically in the tropics, often replacing primary forests

Full Size Image

Figure 13

Figure 13: Land area used for organic farming is growing at an annual rate of nearly 13%

Full Size Image

In parallel to growing production of fish, the production of other livestock and crops has been rising steadily – 45% between 1992 and 2009 – at a pace nearly two times higher than that of population (26%). The higher yields in cereals, however, are only marginally linked to the total area under cultivation, but depend almost exclusively on intensification, where use of fertilizers plays a major role (UNEP 2011c), along with increasing irrigation. While the latter have expanded steadily (21% since 1992), it accounts for approximately 70% of total freshwater withdrawals worldwide (UNESCO 2001), it puts further pressure on already scarce and partially rapidly decreasing freshwater availability. While a few selected crops (such as sugar cane, soybeans and palm oil) have dramatically expanded in the tropics (+70% between 1992 and 2009) with negative impacts on natural ecosystems, ever-increasing numbers of grazing animals, especially goats (+45% since 1992), degrade already impoverished grasslands in semi-arid climates. Organic farming, as an alternative approach to the (over)use of natural resources, heavy machinery and chemical fertilizers has been greatly expanding (240% between 1999 and 2009), but nevertheless represents less than 1% of the global agricultural land.

The Good News

Nonetheless, there are some signs of positive change as well. As concern about the ever-increasing CO2 emissions and their environmental impacts rises, the Montreal Protocol, responsible for the phasing-out of ozone-depleting substances (ODS), showcases how an international agreement can lead to success, with a decline of 93% in the consumption of ODS between 1992 and 2009. The „perhaps single most successful international agreement“ (Kofi Annan) not only helps to protect the Ozone layer, but leads to substantial co-benefits by reducing climate change, as many ODS are at the same time potent greenhouse gases (WMO/UNEP 2010).

Figure 14

Figure 14: Thanks to the participation and commitment of nearly all countries (195 in 2011), the Montreal Protocol is perhaps the „single most successful international agreement to date“ (Kofi Annan, former UN Secretary-General)

Full Size Image

Figure 15

Figure 15: Numerous international agreements were negotiated in the two decades following the Rio Conference in 1992

Full Size Image

Figure 16

Figure 16: Renewable energy resources (including biomass) currently account for 13% of global energy supply. Solar and wind energy, though with steep growth rates, account for only 0.3% of global energy supply

Full Size Image

The number of Multilateral Environmental Agreements rose by 330% between 1992 and 2010, demonstrating political recognition of environmental issues. On the side of the private sector, environmental management standards are increasingly recognized, as the adoption of the ISO 14000 standard, which codifies practices and standards to minimize harmful impacts on the environment and achieve environmental performance – an increase of 1500% between 1999 and 2009. Investments in sustainable energy have skyrocketed in recent years, with an increase of 540% between 2004 and 2010, reaching US$ 2011 thousand million. For the first time, new investment in utility-scale renewable energy projects and companies in developing countries surpassed that of developed economies (UNEP 2011d). Along with this, renewable energy supply has seen staggering increases (+30000% for solar photovoltaics, +6000% for wind between 1992 and 2009), although solar and wind energy account for only 0.3% of the global energy supply. Including water and especially biomass (wood, dung), renewable energy comprised 16% of the global energy supply in 2010. Trading in CO2 emissions has grown rapidly (+1200% between 2005 and 2010), but due to only partial implementation and lack of clarity about future regulations in a post-Kyoto regime, the mechanisms are today suffering rather large losses in value.

The need for improved monitoring and environmental data

With limited progress on environmental issues achieved, and few real „success stories“ to be told, all components of the environment—land, water, biodiversity, oceans and atmosphere —continue to degrade. Notwithstanding great advances in information and communication technologies, we have not made such breakthroughs when it comes to assessing the state of our environment. Until we apply the same dedication to this issue as we have to other areas, data gaps and inadequate monitoring will continue to hinder sound ‚evidence-based policy-making.‘

The need to focus attention and resources on improved monitoring and environmental data collection at all levels is essential in order to provide reliable and relevant information for decision-making. A new commitment to deal with persistent environmental problems and emerging issues calls for cooperation, flexibility and innovative solutions.

Acknowledgment

Written by: Stefan Schwarzeraa

Production and Outreach Team: Arshia Chanderb, Bruce Pengrab, Erick Litswac, Kim Gieseb, Michelle Anthonyb, Reza Hussainb, Theuri Mwangic

(a UNEP GRID Geneva, b UNEP GRID Sioux Falls, c UNEP GRID Nairobi)

References

Bindoff, N. , Willebrand, J., Artale, V. and others (2007). Observations: Oceanic Climate Change and Sea Level. In Averyt, K., Chen, Z., Manning and others. Climate Change 2007: The Physical Science Basis. Contribution of Working Group I to the Fourth Assessment Report of the Intergovernmental Panel on Climate Change. Cambridge University Press. Cambridge

Caldeira, K. and Wickett, M. (2003). Anthropogenic Carbon and Ocean pH. Nature 425, 365

Collette, B., Carpenter, K. , Polidoro, B. and others (2011). High Value and Long Life—Double Jeopardy for Tunas and Billfi shes. Science DOI: 10.1126/ science.1208730

FAO (2010). Global Forest Resources Assessment 2010. Food and Agriculture Organization, Rome

FAO (2011). The State of World Fisheries and Aquaculture 2010. Food and Agriculture Organization, Rome

Feely, R., Doney, S. and Cooley, S. (2009). Ocean Acidifi cation: Present Conditions and Future Changes in a High-CO2 World. Oceanography 22(4), 36–47

Hansen, J., Sato, M., Ruedy and others (2006). Global Temperature Change. PNAS 103(39), 14288-14293

IPCC (2007). IPCC Fourth Assessment Report: Climate Change 2007: The Physical Science Basis. Intergovernmental Panel on Climate Change, New York

IUCN (2011). Increased Protection Urgently Needed for Tunas. International Union for Conservation of Nature. Accessed on Aug 9, 2011 at http://www.iucn.org/ knowledge/news/?7820

IUCN/UNEP (2011). The World Database on Protected Areas (WDPA). International Union for Conservation of Nature. United Nations Environment Programme. Accessed on July 11, 2011 http://www.protectedplanet.net

JMA (2011). Global Temperature in 2010. Tokyo Climate Center News – Tokyo climate Center. Japan Meteorological Agency. Accessed on Mar 23, 2011 at http:// ds.data.jma.go.jp/tcc/tcc/news/tccnews23.pdf

NASA (2011). NASA Research Finds 2010 Tied for Warmest Year on Record. National Aeronautics and Space Administration. Accessed on Mar 23, 2011 at http://www.giss.nasa.gov/research/news/20110112/

NOAA (2011). State of the Climate: Global Analysis for Annual 2010, published online December 2010. Accessed on August 18, 2011 at http://www.ncdc. noaa.gov/sotc/global/2010/13

Toropova, C., Meliane, I., Laffoley, D., Matthews, E. and Spalding, M. (eds.) (2010). Global Ocean Protection: Present Status and Future Possibilities. Brest, France: Agence des aires marines protégées, Gland, Switzerland, Washington,
DC and New York, USA: IUCN WCPA, Cambridge, UK : UNEP-WCMC, Arlington, USA: TNC, Tokyo, Japan: UNU, New York, USA: WCS. 96pp

UCSUSA (2011). Deforestation Today: It’s Just Business. Union of Concerned Scientist USA. Accessed on Jul 10, 2011 at http://www.ucsusa.org/global_ warming/solutions/forest_solutions/deforestation-today-business.html

UK-MetOffice (2011). 2010 – A Near Record Year. Accessed on Mar 23, 2011 at http://www.metoffice.gov.uk/news/releases/archive/2011/2010-global- temperature

UN (2011). Composition of macro geographical (continental) regions, geographical sub-regions, and selected economic and other groupings. Accessed on Feb 10, 2012 at http://unstats.un.org/unsd/methods/m49/m49regin.htm

UNEP (2010). UNEP Emerging Issues: Environmental Consequences of Ocean Acidifi ciation: A Threat to Food Security. United Nations Environment Programme, Nairobi

UNEP (2011). Keeping Track of Our Changing Environment. United Nations Environment Programme. DEW/1234/NA. Nairobi (Kenya)

UNEP (2011b). UNEP Yearbook 2011. United Nations Environment Programme, Nairobi

UNEP (2011c). Decoupling Natural Resource Use and Environmental Impacts from Economic Growth. United Nations Environment Programme, Paris

UNEP (2011d). Towards a Green Economy: Pathways to Sustainable Development and Poverty Eradication – A Synthesis for Policy Makers. United Nations Environment Programme, St-Martin Bellevue

UNESCO (2001). Securing the Food Supply, World Water Assessment Program. United Nations Educational, Scientific and Cultural Organization

van der Werf, G. R. , Morton, D. C., DeFries, R. S., Olivier, J. G. J., Kasibhatla, P. S., Jackson, R. B., Collatz, G. J. and Randerson, J. T. (2009). CO2 Emissions from Forest Loss. Nature Geoscience 2, 737-738

WGMS (2010). Glacier Mass Balance Data 1980-2009. World Glacier Monitoring Service, Zurich, Switzerland. Accessed on Aug 17, 2011 at http://www.wgms.ch

WMO/UNEP (2010). Scientific Assessment of Ozone Depletion 2010. World Meteorological Organization. United Nations Environment Programme, Nairobi


If you no longer wish to receive this bulletin you can unsubscribe anytime.
Information is regularly scanned, screened, filtered, carefully edited, and published for educational purposes. UNEP does not accept any liability or responsibility for the accuracy, completeness, or any other quality of information and data published or linked to the site. Please read our privacy policy and disclaimer for further information.

Posted by Stefan in Landwirtschaft, 0 comments